22 Plotting snippets
This recipe contains various plotting snippets for various visualization challenges. All snippets will use the ae demo emuDB. Let us create and load that emuDB:
library(emuR)
library(tidyverse) # containing - amongst others - dplyr, purrr, tibble, and ggplot2

# create demo data in directory provided by the tempdir() function
# (of course other directory paths may be chosen)
create_emuRdemoData(dir = tempdir())

# create path to demo data directory, which is
# called "emuR_demoData"
demo_data_dir = file.path(tempdir(),
                          "emuR_demoData")

# create path to ae_emuDB which is part of the demo data
path2ae = file.path(demo_data_dir,
                    "ae_emuDB")

# load database
# (verbose = F is only set to avoid additional output in manual)
ae = load_emuDB(path2ae, verbose = F)
22.1 Formant trajectory plots (equivalent to the legacy dplot(..., normalise = T/F, average = T/F,...))
# query A and V (front and back open vowels),
# i:and u: (front and back closed vowels), and
# E and o: (front and back mid vowels)
ae_vowels = query(emuDBhandle = ae,
                  query = "[Phonetic == V | A | i: | u: | o: | E]")
#get the formants:
ae_formants = get_trackdata(ae,
                            seglist = ae_vowels,
                            ssffTrackName = "fm",
                            resultType = "tibble")

# plot all F2 trajectories
# (note that T1 == F1, T2 == F2, ...)
ggplot(ae_formants) +
  aes(x = times_rel, y = T2, col = labels, group = sl_rowIdx) +
  geom_line() +
  labs(x = "time (ms)", y = "F2 (Hz)") +
  theme(legend.position = "none")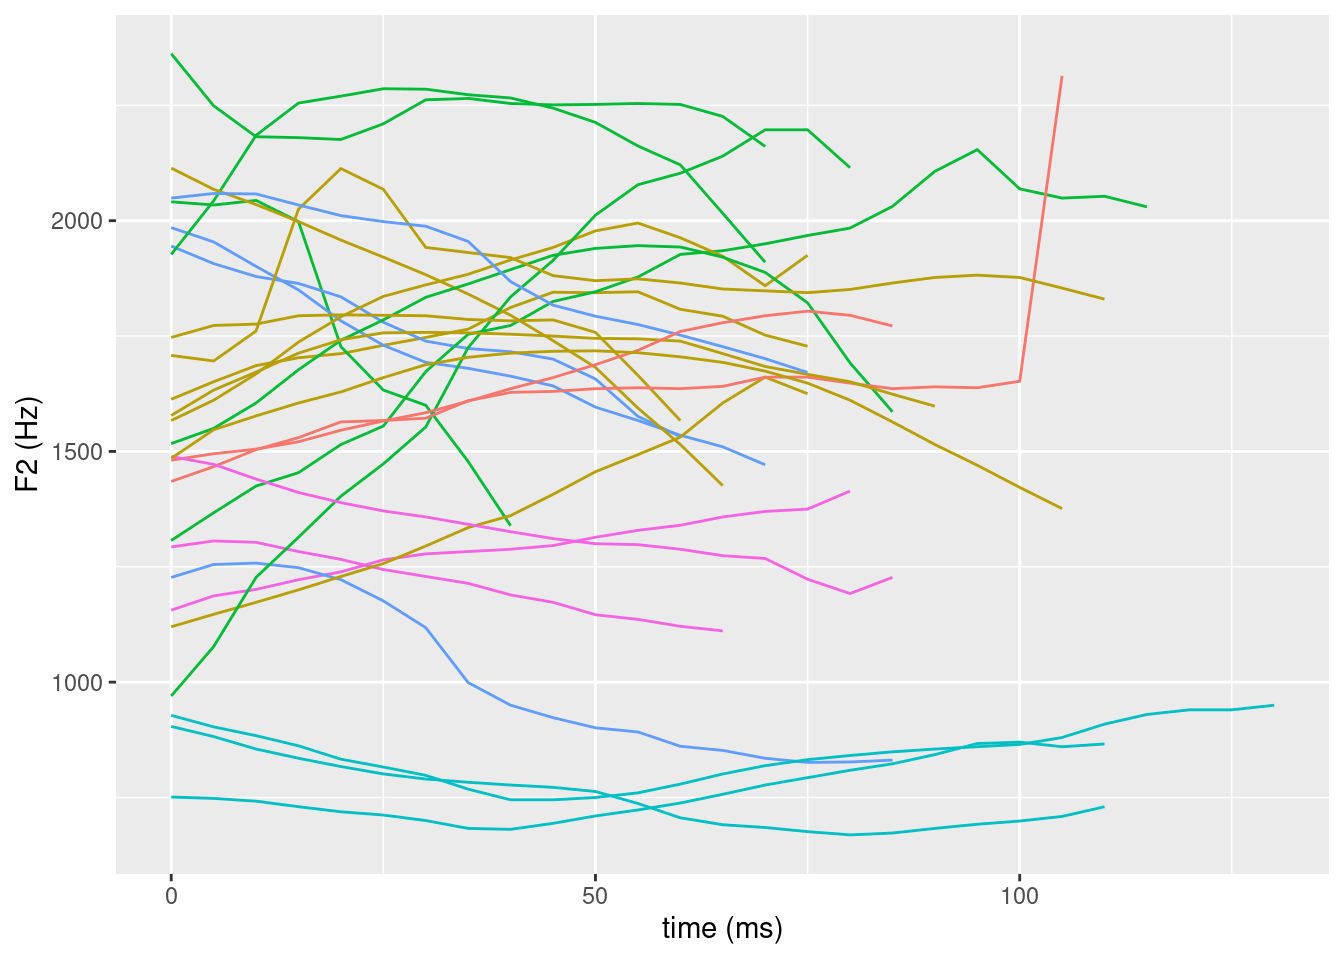
# time normalize the formant values
ae_formants_norm = normalize_length(ae_formants)

# plot all normalized F2 trajectories
ggplot(ae_formants_norm) +
  aes(x = times_norm, y = T2, col = labels, group = sl_rowIdx) +
  geom_line() +
  labs(x = "normalized time", y = "F2 (Hz)") +
  theme(legend.position = "none")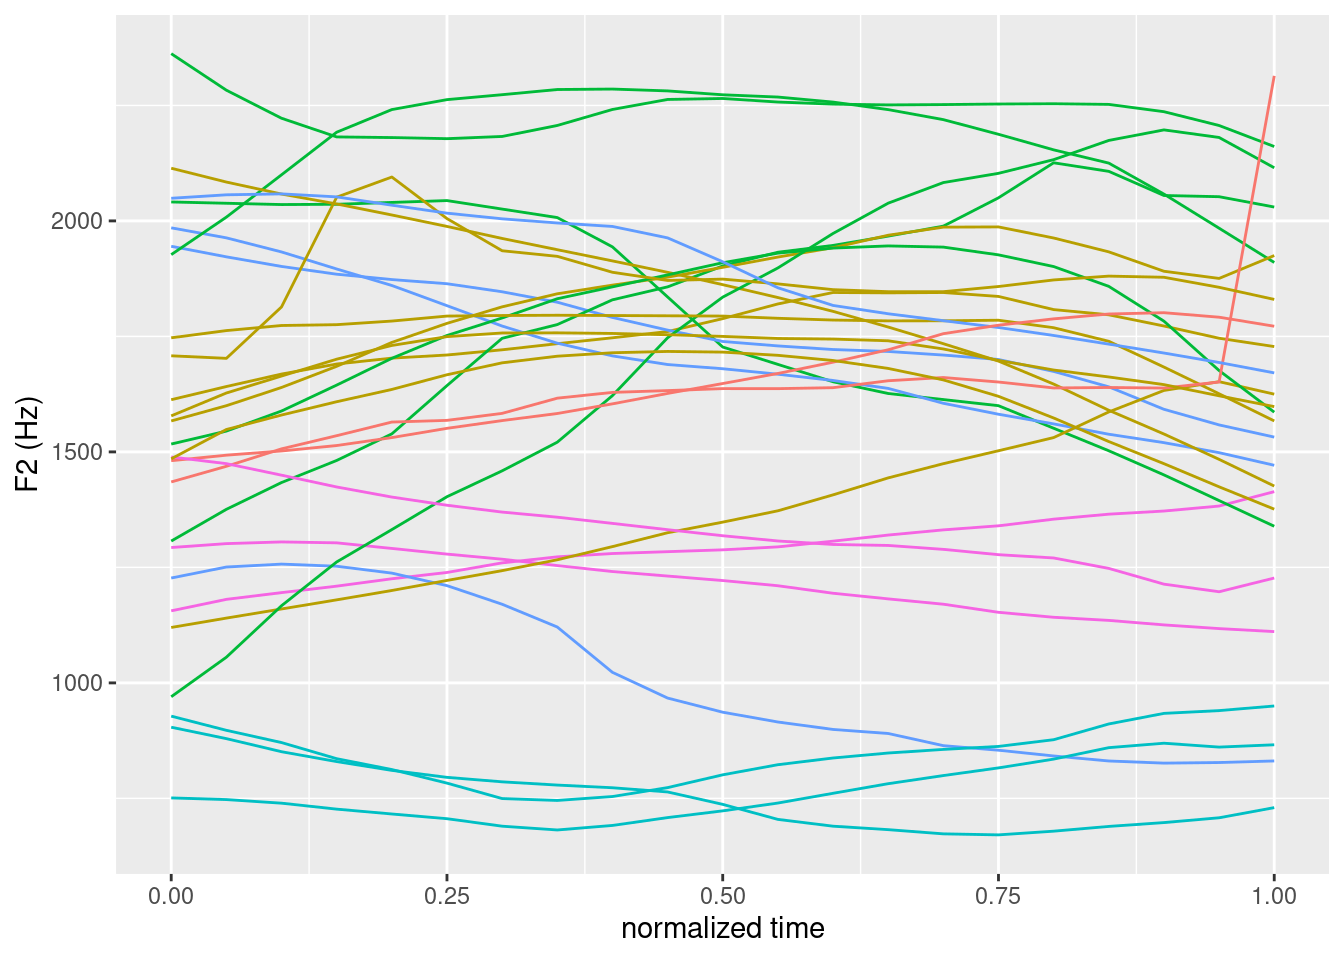
# calculate and plot averages (== dplot(..., average = T, ...))
ae_formants_norm_average = ae_formants_norm %>%
  group_by(labels, times_norm) %>%
  summarise(F2 = mean(T2))

ggplot(ae_formants_norm_average) +
  aes(x = times_norm, y = F2, col = labels) +
  geom_line() +
  labs(x = "normalized time", y = "F2 (Hz)") +
  theme(legend.position = "none")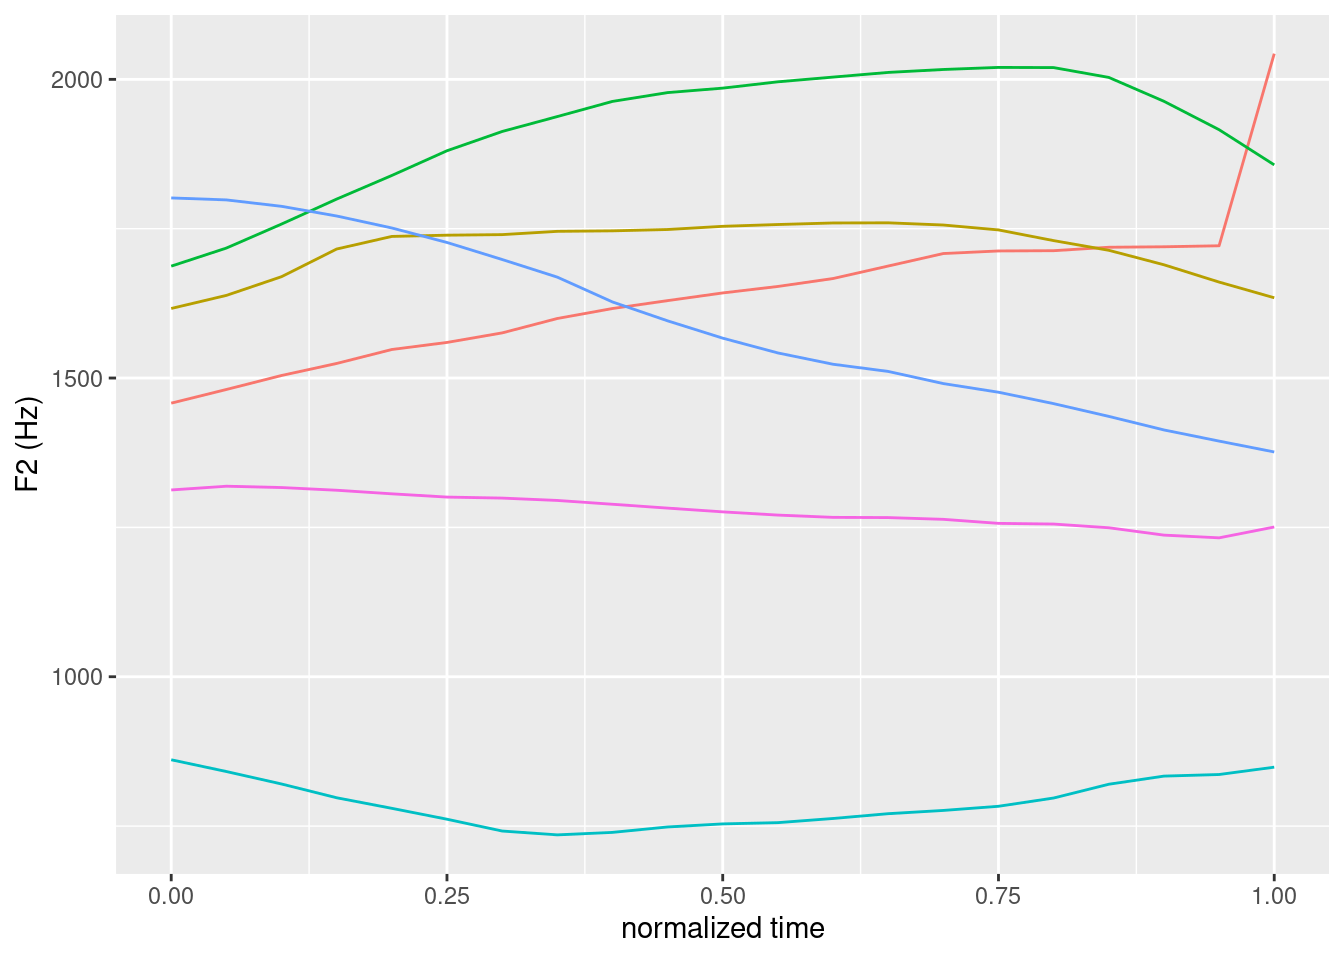
22.2 F1/F2 plots (equivalent to the legacy eplot(..., dopoints = T/F, doellipse = T/F, centroid = T/F, ...))
# query A and V (front and back open vowels),
# i:and u: (front and back closed vowels), and
# E and o: (front and back mid vowels)
ae_vowels = query(emuDBhandle = ae,
                  query = "[Phonetic == V | A | i: | u: | o: | E]")
#get the formants:
ae_formants = get_trackdata(ae,
                            seglist = ae_vowels,
                            ssffTrackName = "fm",
                            resultType = "tibble")

# time normalize the formant values
ae_formants_norm = normalize_length(ae_formants)

# extract the temporal mid-points
ae_midpoints = ae_formants_norm %>%
  filter(times_norm == 0.5)

# plot F1 & F2 values (== eplot(..., dopoints = T, doellipse = F, centroid = F, ...))
ggplot(ae_midpoints) +
  aes(x = T2, y = T1, label = labels, col = labels) +
  geom_text() +
  scale_y_reverse() + scale_x_reverse() +
  labs(x = "F2 (Hz)", y = "F1 (Hz)") +
  theme(legend.position = "none")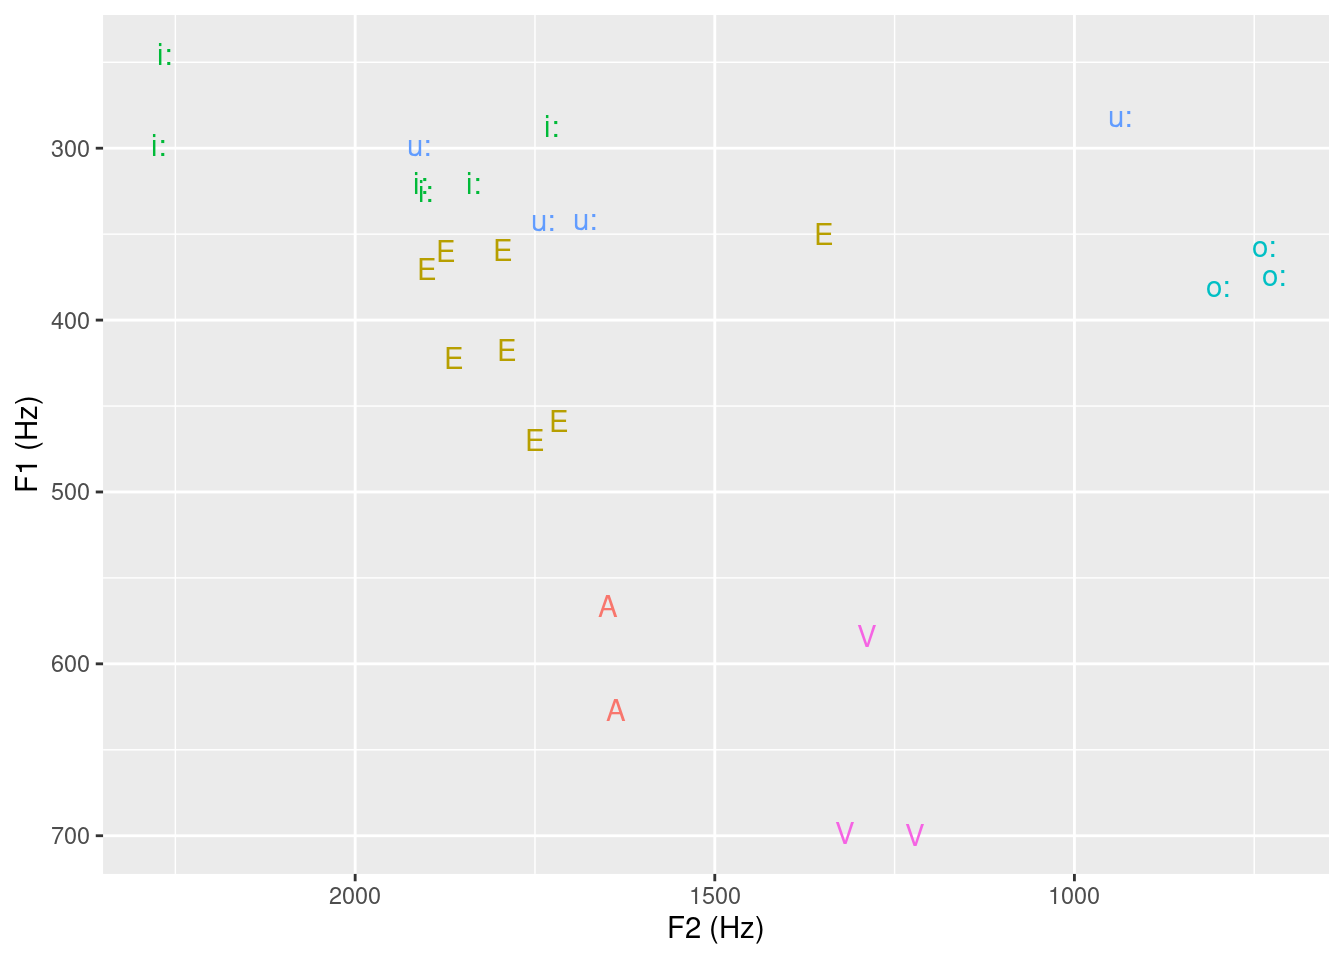
# plot F1 & F2 values (== eplot(..., dopoints = T, doellipse = T, centroid = F, ...))
ggplot(ae_midpoints) +
  aes(x = T2, y = T1, label = labels, col = labels) +
  geom_text() +
  stat_ellipse() +
  scale_y_reverse() + scale_x_reverse() +
  labs(x = "F2 (Hz)", y = "F1 (Hz)") +
  theme(legend.position = "none")
## Warning: Removed 3 row(s) containing missing values (geom_path).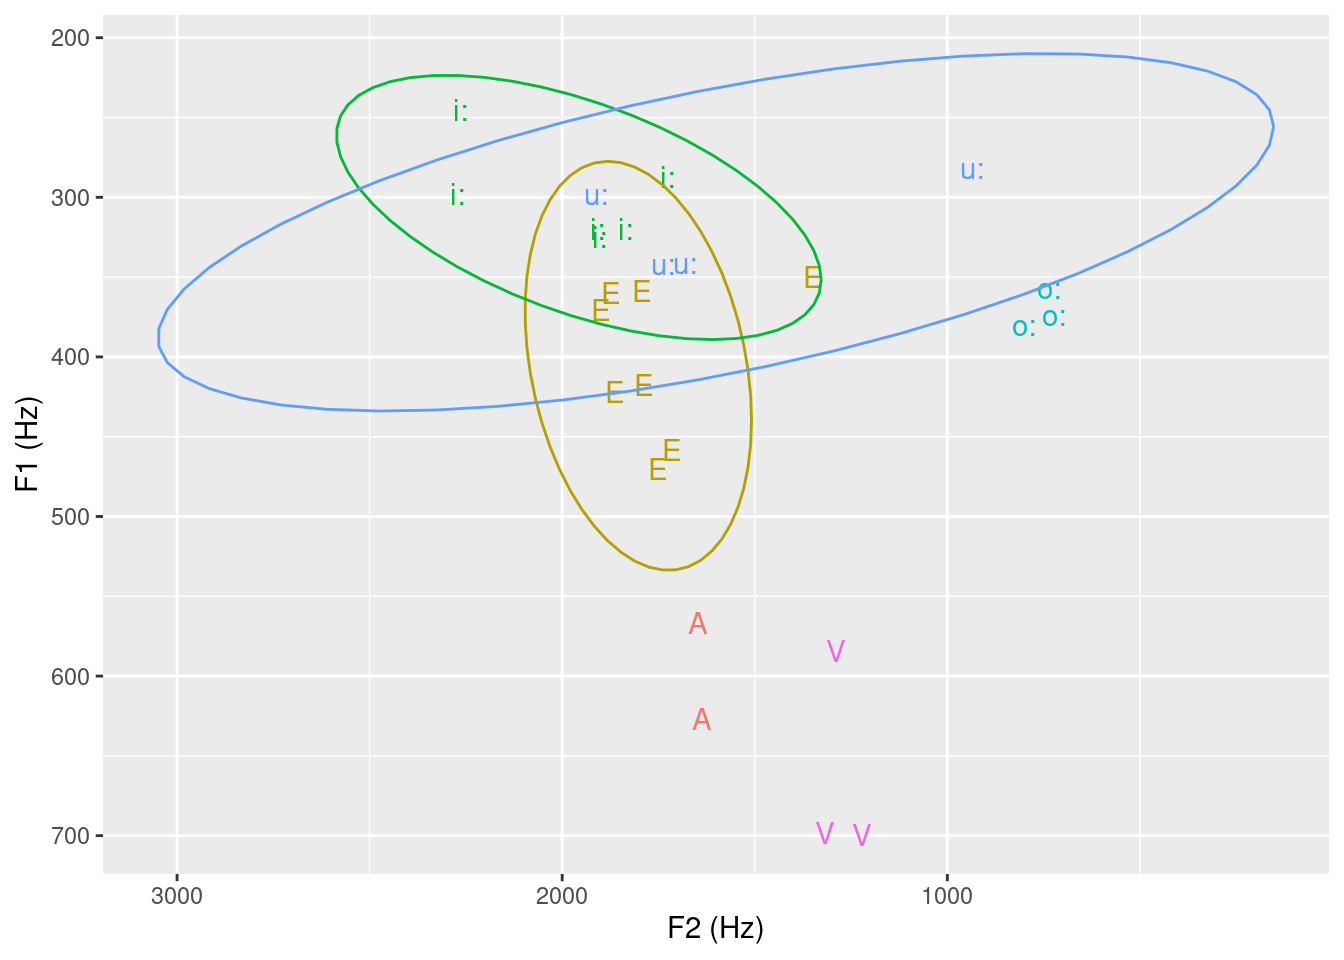
# filter out vowels with enough data points
# to calc. ellipse
ae_midpoints_Eiu = ae_midpoints %>% filter(labels%in%c("E","i:","u:"))

ae_centroid = ae_midpoints_Eiu %>%
  group_by(labels) %>%
  summarise(T1 = mean(T1), T2 = mean(T2))

# plot F1 & F2 values (== eplot(..., dopoints = T, doellipse = T, centroid = T, ...))
ggplot(ae_midpoints_Eiu) +
  aes(x = T2, y = T1, label = labels, col = labels) +
  stat_ellipse() +
  scale_y_reverse() + scale_x_reverse() +
  labs(x = "F2 (Hz)", y = "F1 (Hz)") +
  theme(legend.position = "none") +
  geom_text(data = ae_centroid)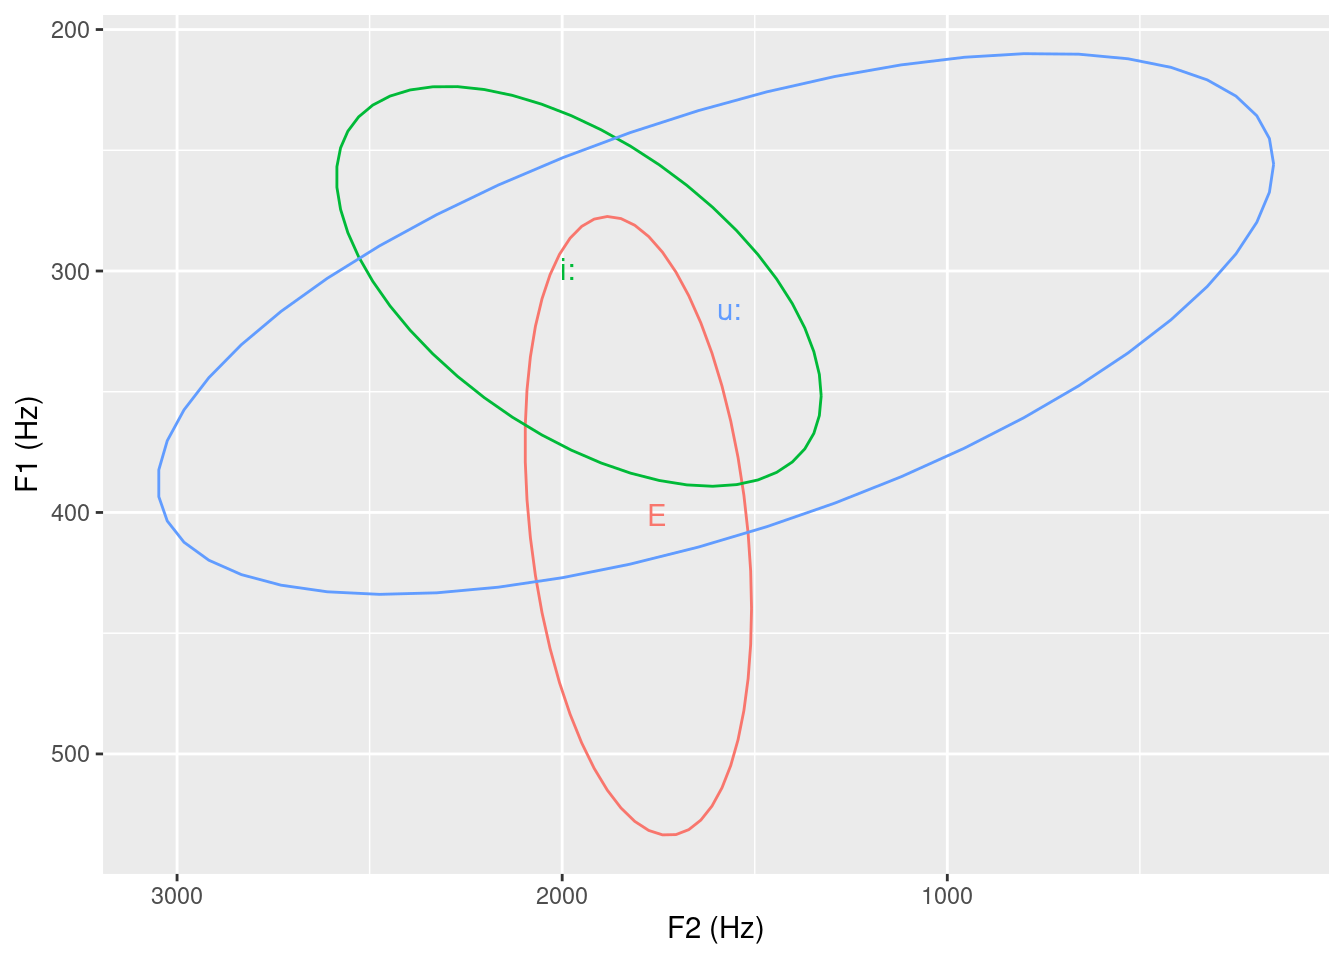
Regarding stat_ellipse() this is worth pointing out: https://github.com/tidyverse/ggplot2/issues/2776
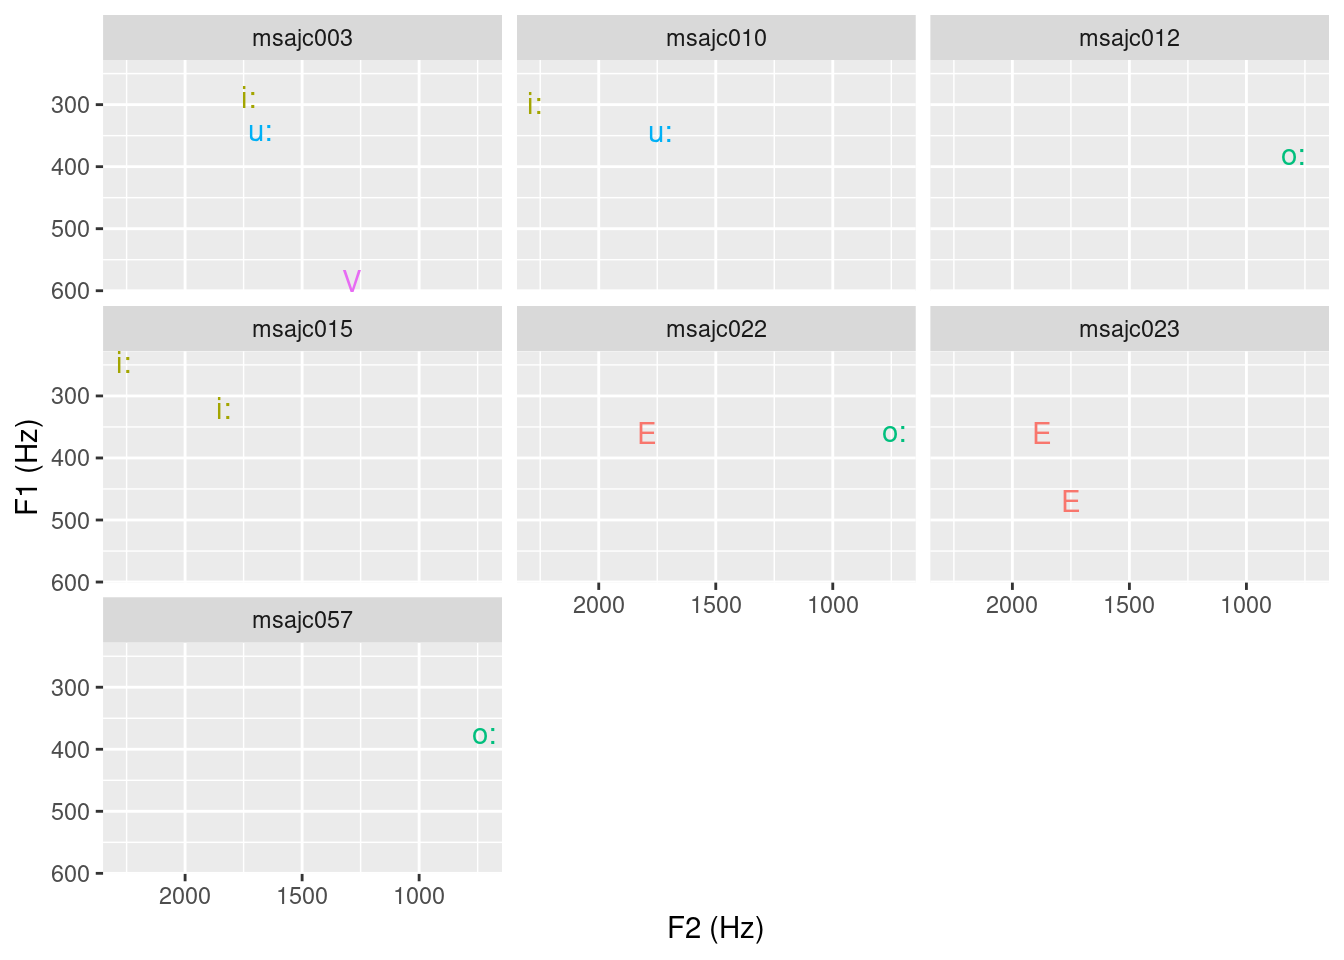
22.3 F1/F2 plot separated by speaker
# query A and V (front and back open vowels),
# i:and u: (front and back closed vowels), and
# E and o: (front and back mid vowels)
ae_vowels = query(emuDBhandle = ae,
                  query = "[Phonetic == V | A | i: | u: | o: | E]")
#get the formants:
ae_formants = get_trackdata(ae,
                            seglist = ae_vowels,
                            ssffTrackName = "fm",
                            resultType = "tibble")

# extract the temporal mid-points
ae_midpoints = ae_formants %>%
  filter(times_norm == 0.5)

# plot using facet_wrap()
# to plot vowels separately for every bundle
# (this assumes that every bundle contains a different
# speaker which is actually not the case in the ae emuDB)
ggplot(ae_midpoints) +
  aes(x = T2, y = T1, label = labels, col = labels) +
  geom_text() +
  scale_y_reverse() + scale_x_reverse() +
  labs(x = "F2 (Hz)", y = "F1 (Hz)") +
  theme(legend.position = "none") +
  facet_wrap(~bundle)